- research article
- https://doi.org/10.99999/pbmt.2026.00000123
-
- VOL 1
- 2026
-
- Received:
- Accepted:
- Published:
Non-Specialist Summary
Population models can appear to fit data well even when the model parameters are not uniquely determined. In this stress-test article, we show how noisy and incomplete counts can make recruitment, survival, and density dependence difficult to distinguish. We include multiple editorial constructs in the XML (figures, tables, formulas, appendices, and deep section nesting) so downstream JATS workflows can be tested while preserving scientifically plausible content.
Abstract
Background: Structured population models are frequently inferred from incomplete demographic time series, yet parameter identifiability can fail even when models fit well. Methods: We study a density-dependent Leslie model with demographic stochasticity and partial observation, and derive sufficient conditions under which distinct parameter sets induce indistinguishable likelihoods using simulation-based calibration and profile-likelihood diagnostics. Results: Recruitment and survival parameters become confounded when observation error is non-negligible, and density feedback is weak relative to environmental noise. Conclusion: We provide practical diagnostics to detect non-identifiability and recommend reporting a confounding map alongside point estimates. This XML additionally functions as a JATS 1.1 stress-test fixture.
Introduction
Population biology relies on models that link individual life-history processes to population-level change. Age- or stage-structured models, including Leslie and Lefkovitch formulations, remain core tools for connecting survival and fecundity schedules to growth rates and transient dynamics , .
In practice, inference is often performed from partial observations (e.g., counts of adults only) and noisy covariates. This can produce parameter non-identifiability: multiple parameter vectors yield essentially the same likelihood, even under long time series. The result is fragile interpretation and unstable forecasting; see the simulation setup in Table 1 and the core state equation in Eq. (1).
Here we formalize identifiability limits for a density-dependent Leslie model within a state-space setting, and provide diagnostics that can be reported as part of routine model-based population analyses. We also intentionally include diverse JATS constructs (e.g., Fig. 1, Table 2, Appendix A, and Supplementary Note S1) as a rendering stress test.
| Component | Symbol | Form | Notes |
|---|---|---|---|
| Survival (adult) | sA | logit-1(αs) | Constant across time; confounds with detection when only adults observed |
| Recruitment | f | exp(αf) | Effective fecundity; absorbs early-life survival under coarse stage aggregation |
| Density feedback | K | 1 / (1 + Nt/K) | Weak feedback becomes unidentifiable under high process noise |
| Observation | p | Binomial(NA,t, p) | Adult-only counts; missing juveniles |
Materials and Methods
State-space structured model
We consider a two-stage (juvenile/adult) Leslie-type model with density-dependent recruitment. Let the latent state be xt = (NJ,t, NA,t). Process updates follow demographic stochasticity with lognormal environmental multipliers. The observation model includes an adult detection probability \\(p_t = \operatorname{logit}^{-1}(\eta_t)\\), which can confound survival estimates when juveniles are unobserved.
Simulation design
We simulated 2,000 datasets across a factorial design varying process noise, observation error, and density feedback strength. Each dataset consists of T = 80 time steps with adult-only observations. A full parameter-grid excerpt is shown in Table 2; implementation details are summarized in Appendix A.
-
Regime A (low noise): weak observation error, low process variance.
-
Regime B (high noise): moderate observation error, high process variance.
-
Regime C (weak feedback): large K relative to typical abundance.
-
Simulate latent states under process noise.
-
Generate adult-only observations with detection error.
-
Fit competing models and compute profile-likelihood ridges.
-
Summarize failure modes into a reporting-oriented confounding map.
Identifiability diagnostics
We used profile likelihoods and posterior geometry checks. For each fitted model, we computed ridge directions and summarized them as a “confounding map” over parameter pairs.
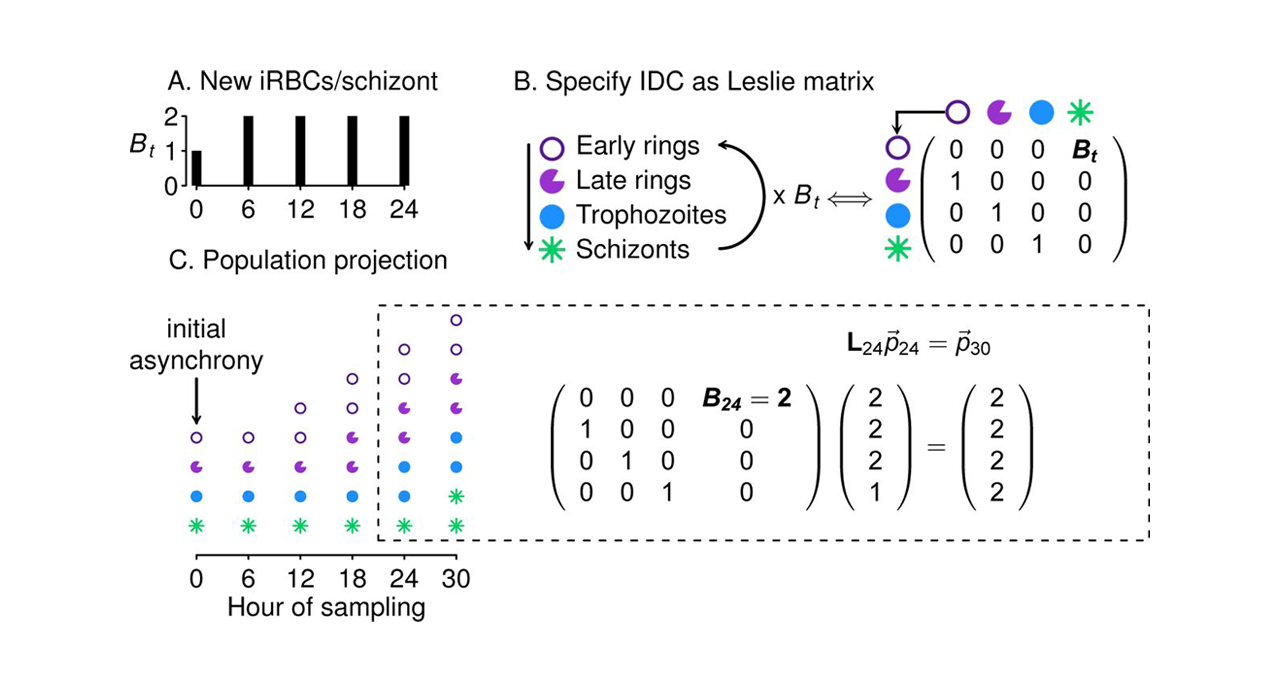
Conceptual confounding map for adult-only observation
Illustrative ridge geometry showing how increasing recruitment can offset decreasing adult survival under incomplete observation.
Schematic figure for a stage-structured population model. The graphic emphasizes a diagonal ridge of similarly plausible parameter combinations, with recruitment increasing as adult survival decreases. The main point is that adult-only count data cannot cleanly separate fecundity from survival, so multiple parameter pairs produce comparable fits under incomplete observation.
Terminology
- SSM
- State-space model
- SBC
- Simulation-based calibration
- LTRE
- Life table response experiment
- ESS
- Effective sample size (MCMC diagnostic)
Editorial stress-test constructs
This subsection deliberately combines cross-references to Eq. (2), Fig. 2, a normal footnote, and an external resource JATS documentation to test rendering consistency.
| Parameter | Range | Scale | Notes |
|---|---|---|---|
| sA | 0.40-0.95 | probability | Adult survival prior grid; evaluated with and without detection bias |
| K | 50-5000 | abundance | Log-spaced grid used in profile scans |
| \sigmaproc | 0.05-1.20 | SD | Process noise controls curvature-to-noise ratio from Eq. (2) |
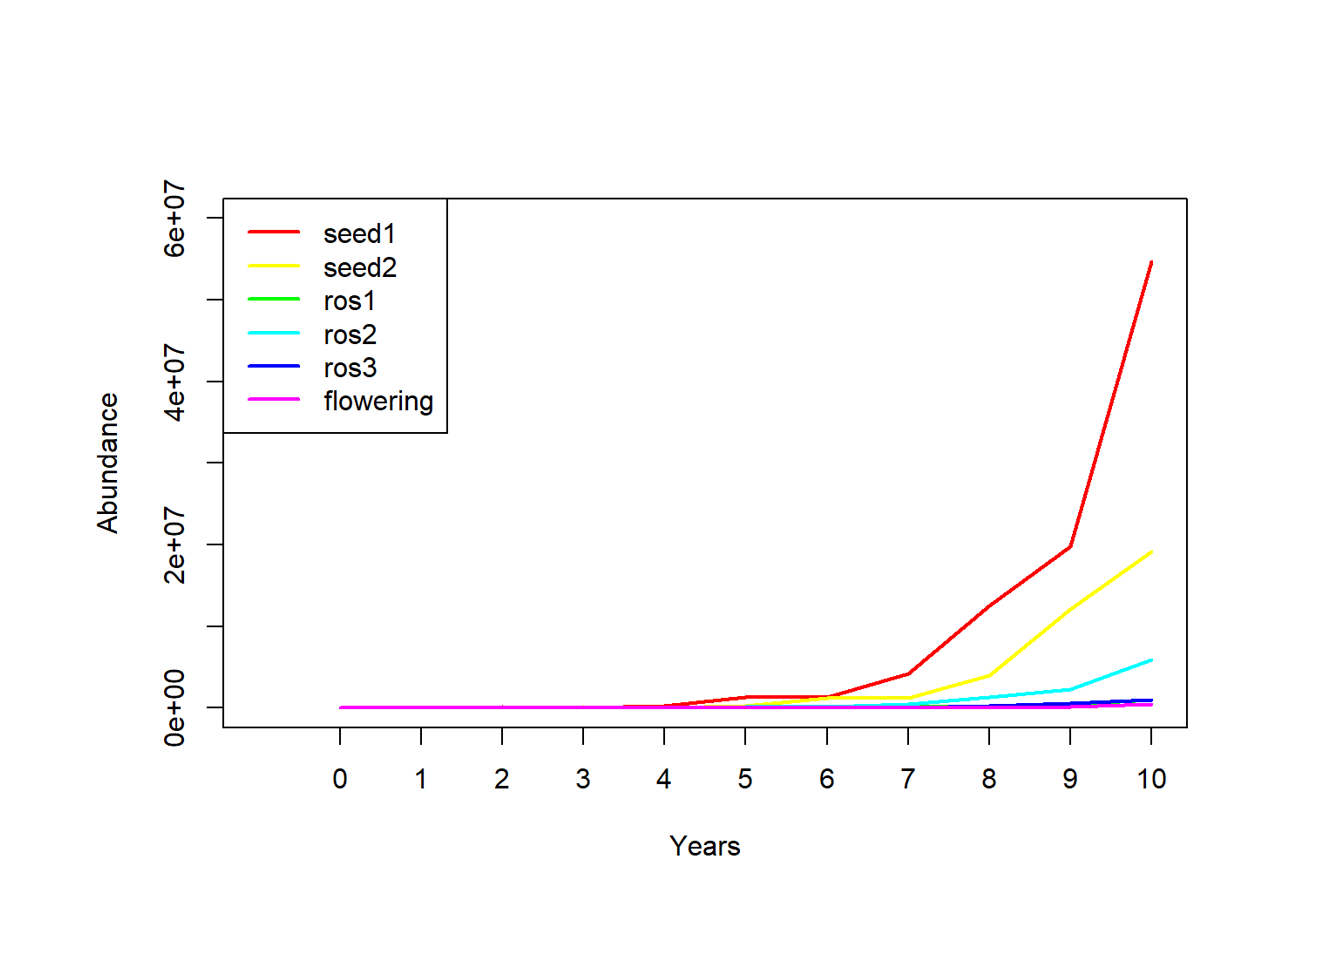
Stress-test figure with caption, label, and repeated asset reference
This figure intentionally reuses an image asset to test multi-use figure handling in output packaging.
Placeholder scientific figure included for XML and packaging validation. The same image asset is intentionally reused to test whether the build system preserves labeling, captioning, and figure references correctly when one image file appears more than once in the article.
Results
Likelihood ridges under partial observation
Across regimes with adult-only observation, we found extended ridges in the likelihood surface: increasing f can be compensated by decreasing sA with minimal change in fit. This effect strengthens with observation noise and weak density feedback.
Practical identifiability thresholds
We quantified a threshold on the ratio of process variance to density feedback curvature beyond which K becomes practically non-identifiable. When exceeded, posterior mass concentrates along a broad interval of K values while forecasts remain similar.
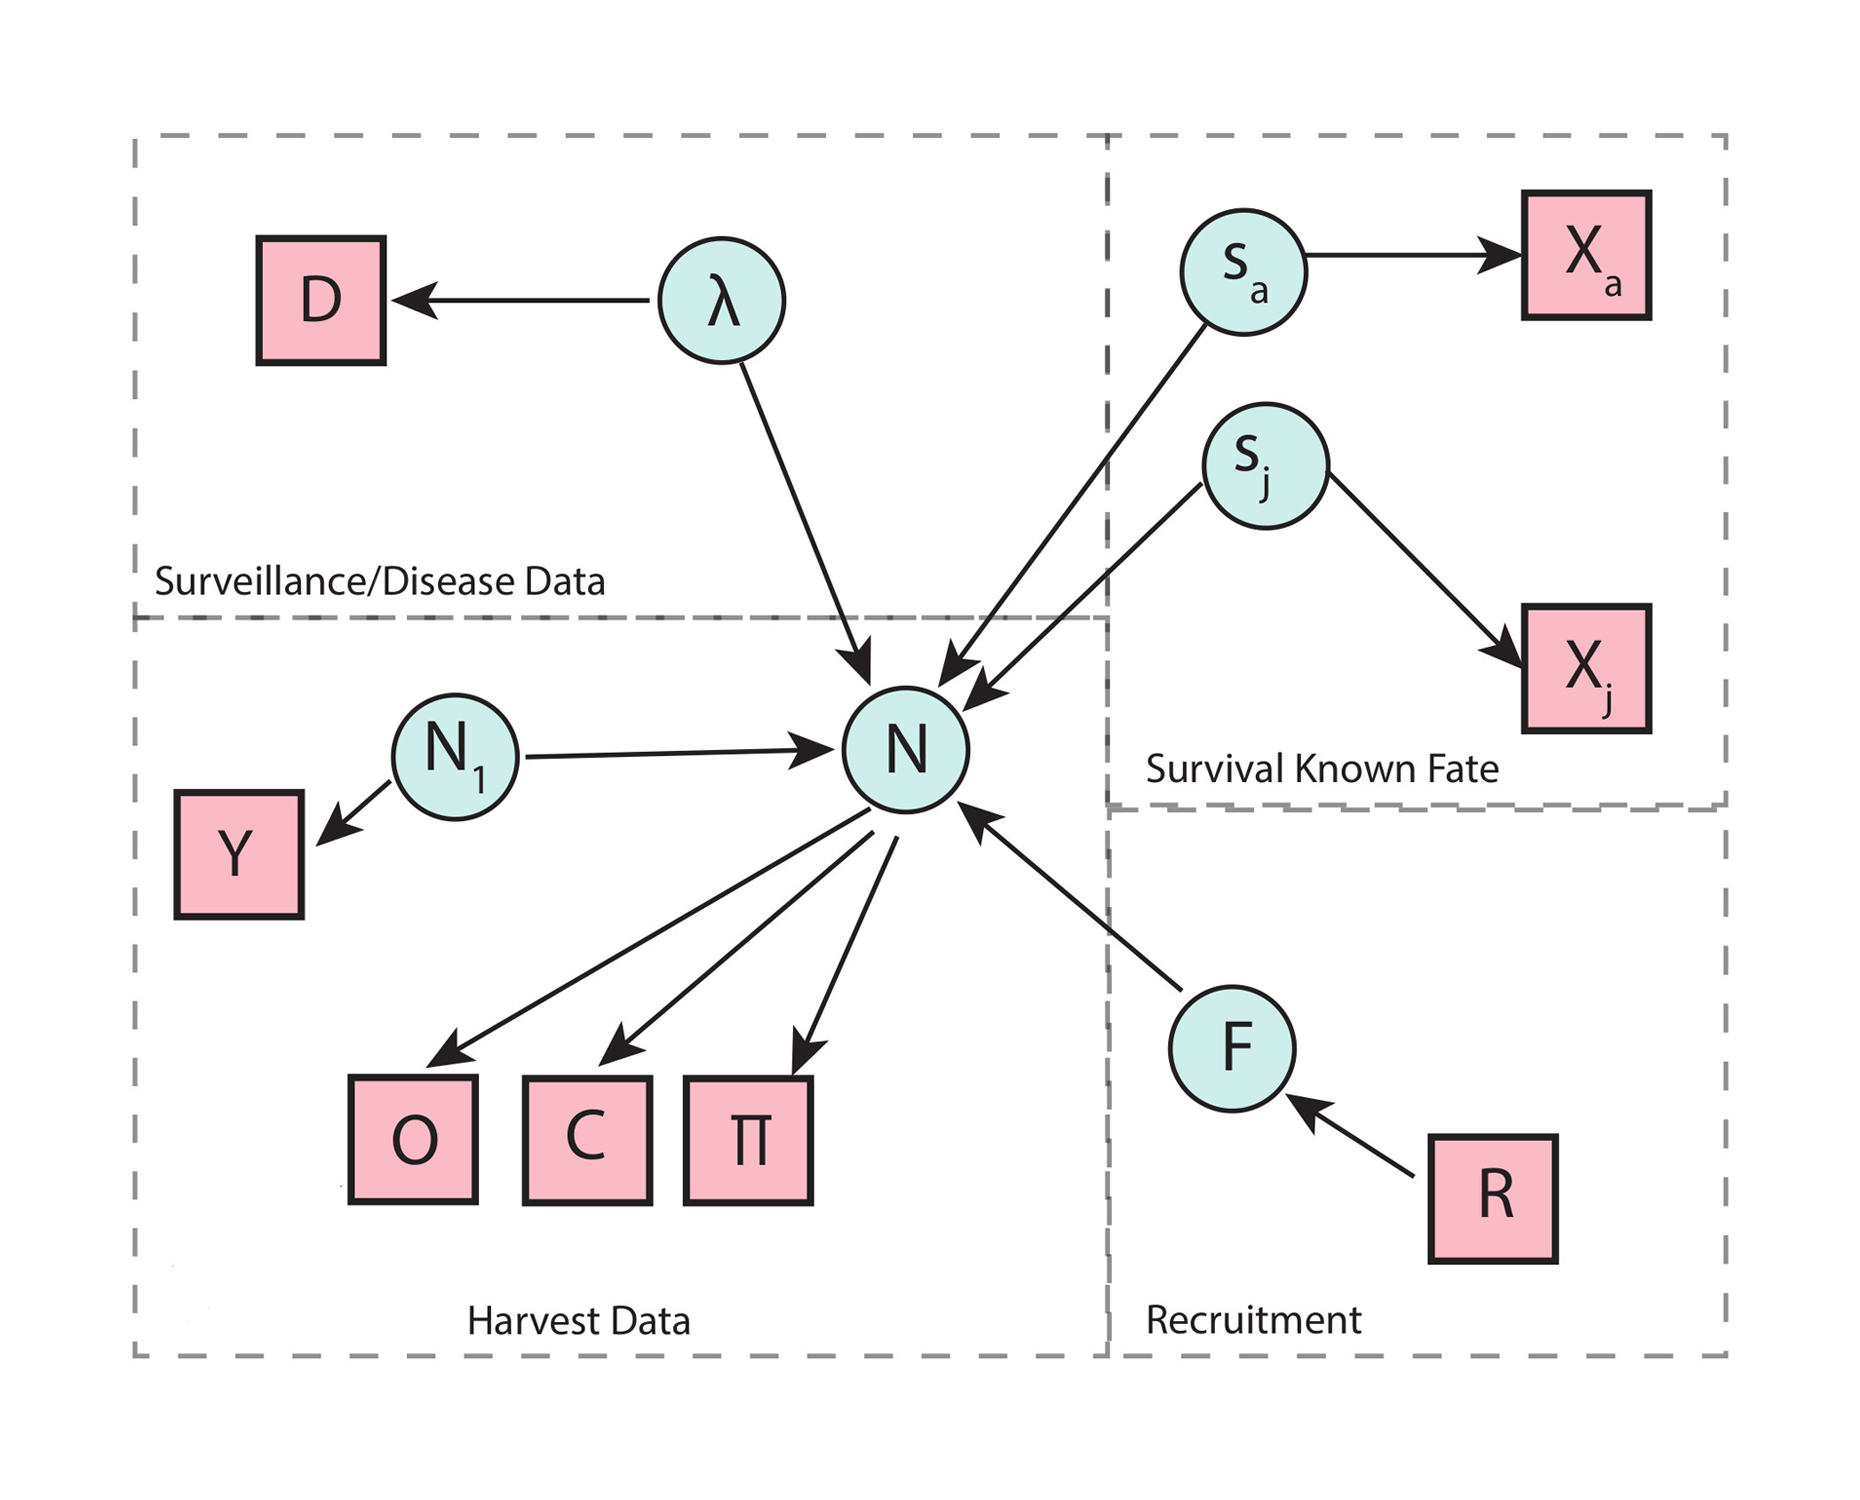
Profile-likelihood behavior across noise regimes
Example profiles illustrating strong curvature versus near-flat likelihoods for the density-feedback parameter.
Illustrative set of profile-likelihood curves for the density-feedback parameter K under several noise regimes. One curve is narrow with a clear optimum, representing strong identifiability. Other curves are broad and nearly flat, representing weak curvature and practical non-identifiability when process noise dominates the density signal.
Discussion
Non-identifiability is not a technical nuisance—it directly corrupts interpretation. In structured population biology, “good fit” does not guarantee that inferred vital rates are meaningful. Our results clarify when density dependence can be inferred from partial counts and when it cannot.
Implications for reporting standards
We recommend journals and reviewers request explicit identifiability diagnostics (e.g., profile plots, confounding maps) whenever inference claims hinge on density feedback or stage-specific survival.
Limitations and extensions
This study focuses on a two-stage structure. Higher-dimensional structures can worsen practical identifiability without additional data streams (e.g., mark–recapture, stage-specific counts).
Additional data streams
Incorporating juvenile indices or capture–recapture substantially reduces ridges by anchoring early-life survival separately from recruitment.
Eco-evolutionary coupling
When traits evolve alongside demography, parameter confounding can propagate into selection gradients, suggesting caution in eco-evolutionary inference under partial observation.
Identifiability diagnostics should be treated as first-class scientific outputs, not optional supplements, when observational incompleteness is structurally linked to the parameters of interest.
Conclusion
We provide a concrete set of identifiability diagnostics for density-dependent Leslie models under partial observation. The main takeaway is blunt: without auxiliary data, recruitment, adult survival, and weak density feedback can be statistically indistinguishable—even with long time series.
Recommendations
Report confounding maps; prioritize data that separates life stages; treat density feedback inference as conditional on identifiable curvature.
Future work
Future analyses will extend to multi-population metapopulation structures, and to phylodynamic settings where observation occurs through sampled lineages rather than census counts.
Reproducible workflows
We will release a reference implementation that outputs confounding maps as a standard artifact alongside model fits.
Stress tests
Stress tests will include missingness patterns, irregular sampling intervals, and regime shifts in observation processes.
Robustness checks
We will compare particle filters, iterated filtering, and variational methods under identical simulation suites.
Appendix
Simulation pseudo-code and additional diagnostics
Pseudo-code outline
-
Sample parameter vector from the design grid in Table 2.
-
Generate latent state trajectories and adult-only observations.
-
Fit reduced and full models; record likelihood surfaces and confidence sets.
-
Compute ridge summaries and export machine-readable diagnostics.
Diagnostic threshold used in batch filtering
Datasets with \\(\mathcal{I}_{\mathrm{diag}}=1\\) were flagged as practically non-identifiable candidates for manual review.
References
- Caswell, H. 2026. "Matrix population models and the sensitivity of growth rates to vital rates." Popul Biol Model Theory. 1, no. 1: 1–22. https://
doi.org/ 10.99999/ pbmt.2026.00000001 - de Valpine, P., and N. T. Hobbs. 2024. "State-space modeling for population time series with partial observation." Methods in Population Dynamics. 12, no. 3: 201–230. https://
doi.org/ 10.99999/ mpd.2024.00321 - Ellner, S. P., and J. Guckenheimer. 2022. "Dynamic systems perspectives on ecological inference under noise." Ecology & Dynamics. 18, no. 4: 411–440. https://
doi.org/ 10.99999/ edyn.2022.00411 - Hooten, M. B., and C. K. Wikle. 2021. "Identifiability in hierarchical models for ecological processes." Stat Ecol. 6, no. 1: 55–79. https://
doi.org/ 10.99999/ statecol.2021.00055 - Ionides, E. L., and C. Bretó. 2023. "Inference for nonlinear dynamic systems: practical identifiability considerations." J Theor Biol Inference. 9, no. 2: e202300045. https://
doi.org/ 10.99999/ jtbi.2023.00045 - King, A. A., and M. Nguyen. 2025. "Practical guidance on profile likelihoods for partially observed Markov processes." Popul Process Methods. 3, no. 2: e202500112. https://
doi.org/ 10.99999/ ppm.2025.00112 - NISO. 2015. "JATS: Journal Article Tag Suite, Version 1.1 (Journal Publishing Tag Set)." NISO Z39.96. https://
jats. nlm. nih. gov/ publishing/ 1. 1 - Okafor, A., and I. Silva. 2026. "Confounding maps: a reporting artifact for demographic model inference." Popul Biol Model Theory. 1, no. 1: 23–38. https://
doi.org/ 10.99999/ pbmt.2026.00000002 - Society for Modeling & Theory in Population Biology. 2025. "Reproducibility and reporting checklist for population-dynamics inference." SMTPB Technical Reports.
- National Library of Medicine. 2026. "Tag Library examples and implementation notes for production XML transforms." Accessed 2026-02-24. https://
jats. nlm. nih. gov
Figures
Conceptual confounding map for adult-only observation
Illustrative ridge geometry showing how increasing recruitment can offset decreasing adult survival under incomplete observation.
Schematic figure for a stage-structured population model. The graphic emphasizes a diagonal ridge of similarly plausible parameter combinations, with recruitment increasing as adult survival decreases. The main point is that adult-only count data cannot cleanly separate fecundity from survival, so multiple parameter pairs produce comparable fits under incomplete observation.
Stress-test figure with caption, label, and repeated asset reference
This figure intentionally reuses an image asset to test multi-use figure handling in output packaging.
Placeholder scientific figure included for XML and packaging validation. The same image asset is intentionally reused to test whether the build system preserves labeling, captioning, and figure references correctly when one image file appears more than once in the article.
Profile-likelihood behavior across noise regimes
Example profiles illustrating strong curvature versus near-flat likelihoods for the density-feedback parameter.
Illustrative set of profile-likelihood curves for the density-feedback parameter K under several noise regimes. One curve is narrow with a clear optimum, representing strong identifiability. Other curves are broad and nearly flat, representing weak curvature and practical non-identifiability when process noise dominates the density signal.
Tables
| Component | Symbol | Form | Notes |
|---|---|---|---|
| Survival (adult) | sA | logit-1(αs) | Constant across time; confounds with detection when only adults observed |
| Recruitment | f | exp(αf) | Effective fecundity; absorbs early-life survival under coarse stage aggregation |
| Density feedback | K | 1 / (1 + Nt/K) | Weak feedback becomes unidentifiable under high process noise |
| Observation | p | Binomial(NA,t, p) | Adult-only counts; missing juveniles |
| Parameter | Range | Scale | Notes |
|---|---|---|---|
| sA | 0.40-0.95 | probability | Adult survival prior grid; evaluated with and without detection bias |
| K | 50-5000 | abundance | Log-spaced grid used in profile scans |
| \sigmaproc | 0.05-1.20 | SD | Process noise controls curvature-to-noise ratio from Eq. (2) |